Desmos Graphing Calculator


توضیحات Desmos Graphing Calculator
در دسموس ، ما جهانی از سواد ریاضی جهانی را تصور می کنیم و جهانی را تصور می کنیم که ریاضیات برای همه دانش آموزان قابل دسترسی و لذت بخش است. ما معتقدیم نکته اصلی یادگیری با انجام کار است.
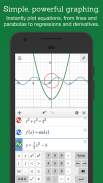
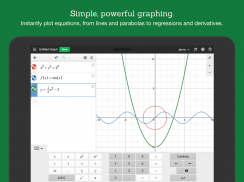
برای دستیابی به این چشم انداز ، ما با ساخت نسل بعدی ماشین حساب نمودار شروع کرده ایم. ماشین حساب با استفاده از موتور ریاضی قدرتمند و سرسام آور سریع ما می تواند فوراً هر معادله ای را از خطوط و سهمی ها از طریق مشتقات و سری فوریه ترسیم کند. لغزنده ها آن را نسیمی برای نشان دادن تحولات عملکرد می کنند. این ریاضی بصری ، زیبا است. و از همه بهتر: کاملا رایگان است.
امکانات:
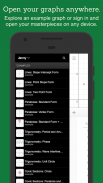
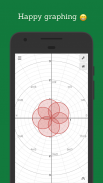
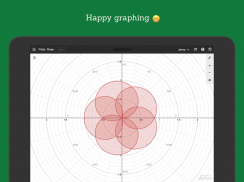
نمودار کردن: نمودارهای قطبی ، دکارتی یا پارامتری را رسم کنید. محدودیتی برای تعداد عبارات شما نمی توانید همزمان داشته باشید - و حتی نیازی به وارد کردن عبارات به شکل y = نیست!
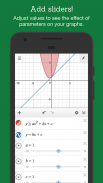
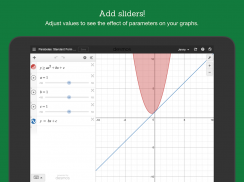
لغزنده ها: برای ایجاد شهود ، مقادیر را به صورت تعاملی تنظیم کنید یا هر پارامتری را متحرک کنید تا تأثیر آن را روی نمودار تجسم کنید.
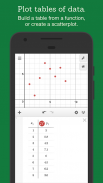
جداول: داده های ورودی و نمودار ، یا برای هر عملکردی یک جدول ورودی-خروجی ایجاد کنید
آمار: خطوط مناسب ، پارابولا و موارد دیگر را پیدا کنید.
بزرگنمایی: محورها را به طور مستقل یا همزمان با فشار دادن دو انگشت مقیاس بندی کنید ، یا اندازه پنجره را به صورت دستی ویرایش کنید تا یک پنجره کامل بدست آورید.
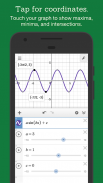
نقاط مورد علاقه: برای نشان دادن حداکثر ، حداقل ها و نقاط تقاطع ، منحنی را لمس کنید. روی نقاط خاکستری مورد علاقه ضربه بزنید تا مختصات آنها را ببینید. نگه دارید و در امتداد یک منحنی بکشید تا ببینید مختصات زیر انگشت شما تغییر می کند.
ماشین حساب علمی: فقط هر معادله ای را که می خواهید حل کنید تایپ کنید و Desmos پاسخ شما را نشان می دهد. این می تواند از ریشه های مربع ، سیاهههای مربوط ، مقدار مطلق و موارد دیگر استفاده کند.
نابرابری ها: نابرابری های دکارتی و قطبی را رسم کنید.
آفلاین: بدون دسترسی به اینترنت مورد نیاز است.
برای کسب اطلاعات بیشتر و دیدن نسخه آنلاین رایگان ماشین حساب ما به سایت www.desmos.com مراجعه کنید.
Desmos Graphing Calculator - نسخه 7.26.0.0
(29-03-2025)

Desmos Graphing Calculator - اطلاعات APK
نسخه APK: 7.26.0.0حزمة: com.desmos.calculatorآخرین نسخه Desmos Graphing Calculator
سایر نسخهها


 3.64
3.64


اپلیکیشنها در دسته مشابه